By combining gross rental yields with the change in property values over the past year (i.e. capital gains), we can look at total investment returns – and unsurprisingly the recent results are strong. Each of the top 10 areas of the country has delivered at least 25% in the past 12 months, with Rangitikei, Clutha, and Gisborne sitting at 30% or more. With momentum now building again across most of the NZ property market, 2020 looks set to deliver another year of strong investment returns.
One of the key property market trends of the past 3-6 months was the return of mortgaged investors, both in terms of number of purchases and their % market share. This week’s CoreLogic NZ Market Pulse takes a look at some of the key property investment metrics and which parts of the country look the most attractive.
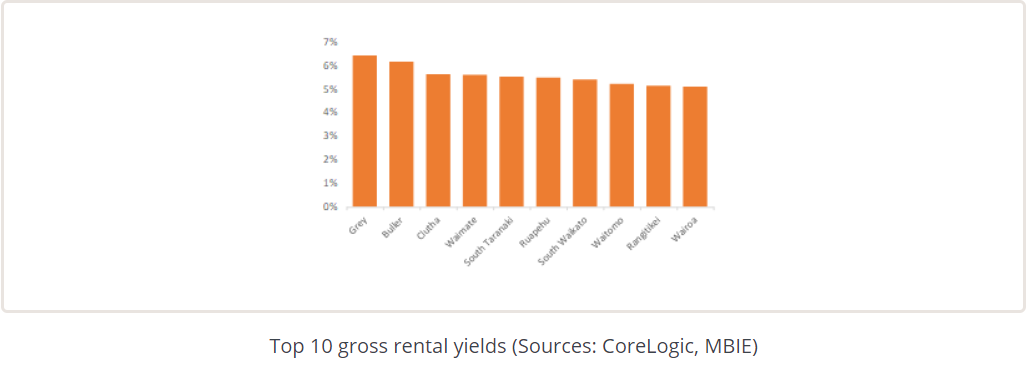
First, it’s gross rental yields. And as the first chart shows, the top 10 areas all have yields in excess of 5% at present. Those are impressive figures, especially when you consider that term deposits are currently paying less than 3%. Of course, these top 10 yielding areas are all small districts, typically with less than 20,000 people, and the greater risk involved (e.g. if a subdued local economy results in weak employment and a greater chance of rent arrears/defaults) necessitates a higher investment return.
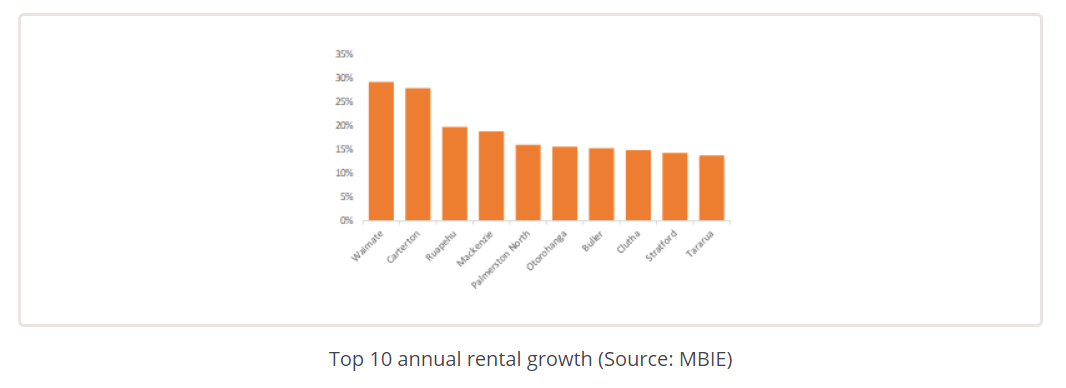
So what happens if we look at the change in rents themselves over the past year? Again, there have been some eye-catching results across the country, with each of the top 10 having seen rents rise by at least 14% over the past 12 months – good for investors, not so much for tenants. Having already featured for high gross yields, Waimate, Ruapehu, Buller, and Clutha pop up again for strong rental growth (see the second chart).
Of course, for many investors, it’s not just about yields and any growth in rents; capital gains are also a key focus. The top 10 here is quite different than for the previous two measures, with larger areas like Gisborne, Wanganui, and Dunedin now featuring (see the third chart). That said, Clutha also makes the top 10 for this measure too, with a rise in average property values over the past year of 25%. It’s worth noting here that although Grey and Buller feature for high yields, they drop down the list when it comes to actual change in property values – in turn, reflecting some degree of uncertainty around their local economies.
Finally, we can look at a total return to investors, by combining the gross yield and the change in property values – as shown in the fourth chart. The capital gains component dominates this measure, so the top 10 for value growth are also the top 10 for total returns, with each of these areas delivering at least 25% in the past 12 months (the gross return on their own capital invested would be even higher for a mortgaged investor).
Looking ahead, rental growth is likely to remain steady across many parts of NZ, and property values still have strong momentum too. Therefore, the returns to existing landlords are likely to remain solid, and aspiring investors will no doubt be keen to get a piece of the action too.
(All information and content in this section is courtesy www.corelogic.co.nz)